Research
Interplay between physical and biological processes within sea ice
When sea water freezes, it rejects the salt, resulting in a complex network of highly saline brine pockets inside the ice. This network is home to a surprising array of life, including bacteria, algae, and grazers small enough to fit inside the brine channels. The physical properties of sea ice and the biological community within are influenced by seasonal and spatial variability in temperature, salinity, and light. We use a variety of mathematical approaches to understand how these factors interact to determine biological activity within the ice.

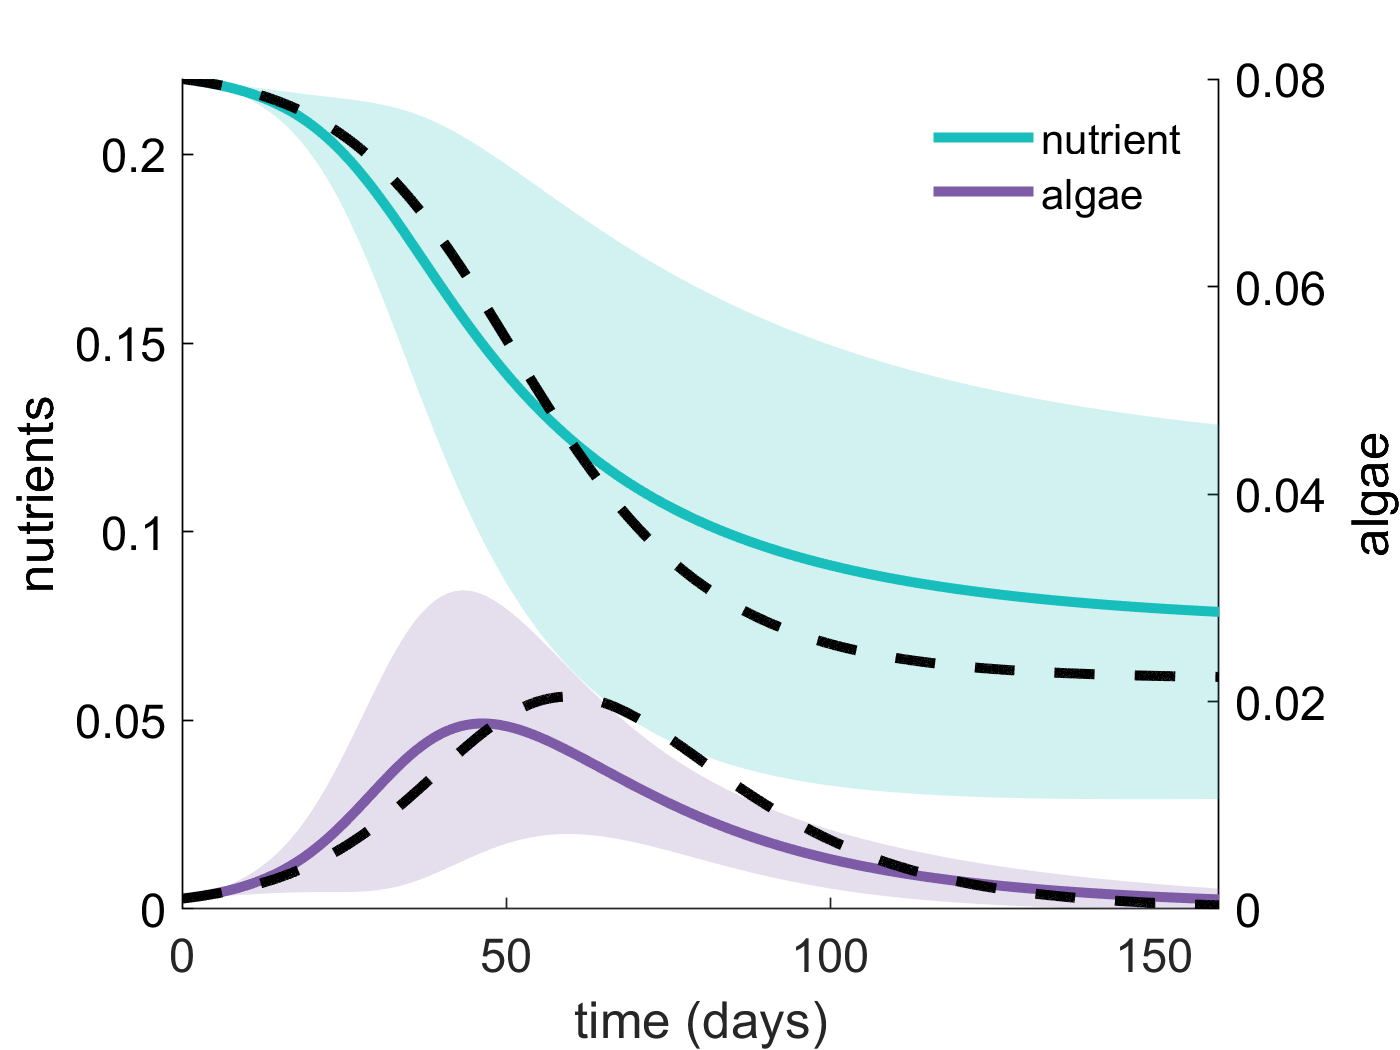

Left: the bottom of an ice core appears brown due to ice algae (photo: J. Reimer). Middle: dynamics of a nutrient-algae model incorporating spatial heterogeneity through random model coefficients, with model behaviour approximated using a polynomial chaos expansion (colored lines), compared with the same model without spatial heterogeneity (black lines), as explored in publication [17]. Right: sea ice field work off the coast of Alaska (photo: J. Reimer).
Modeling marine mammals in a warming Arctic
Environmental changes in the Arctic—both past, present, and future—affect polar bears and ringed seals in myriad ways. Models can help us anticipate and understand individual, population, and community responses to thse changes. Relevant mathematical approaches include stage structured population models and stochastic dynamic programming (an optimal control approach). Current work in this area is focused on optimal polar bear movement through the fractal sea ice landscape.
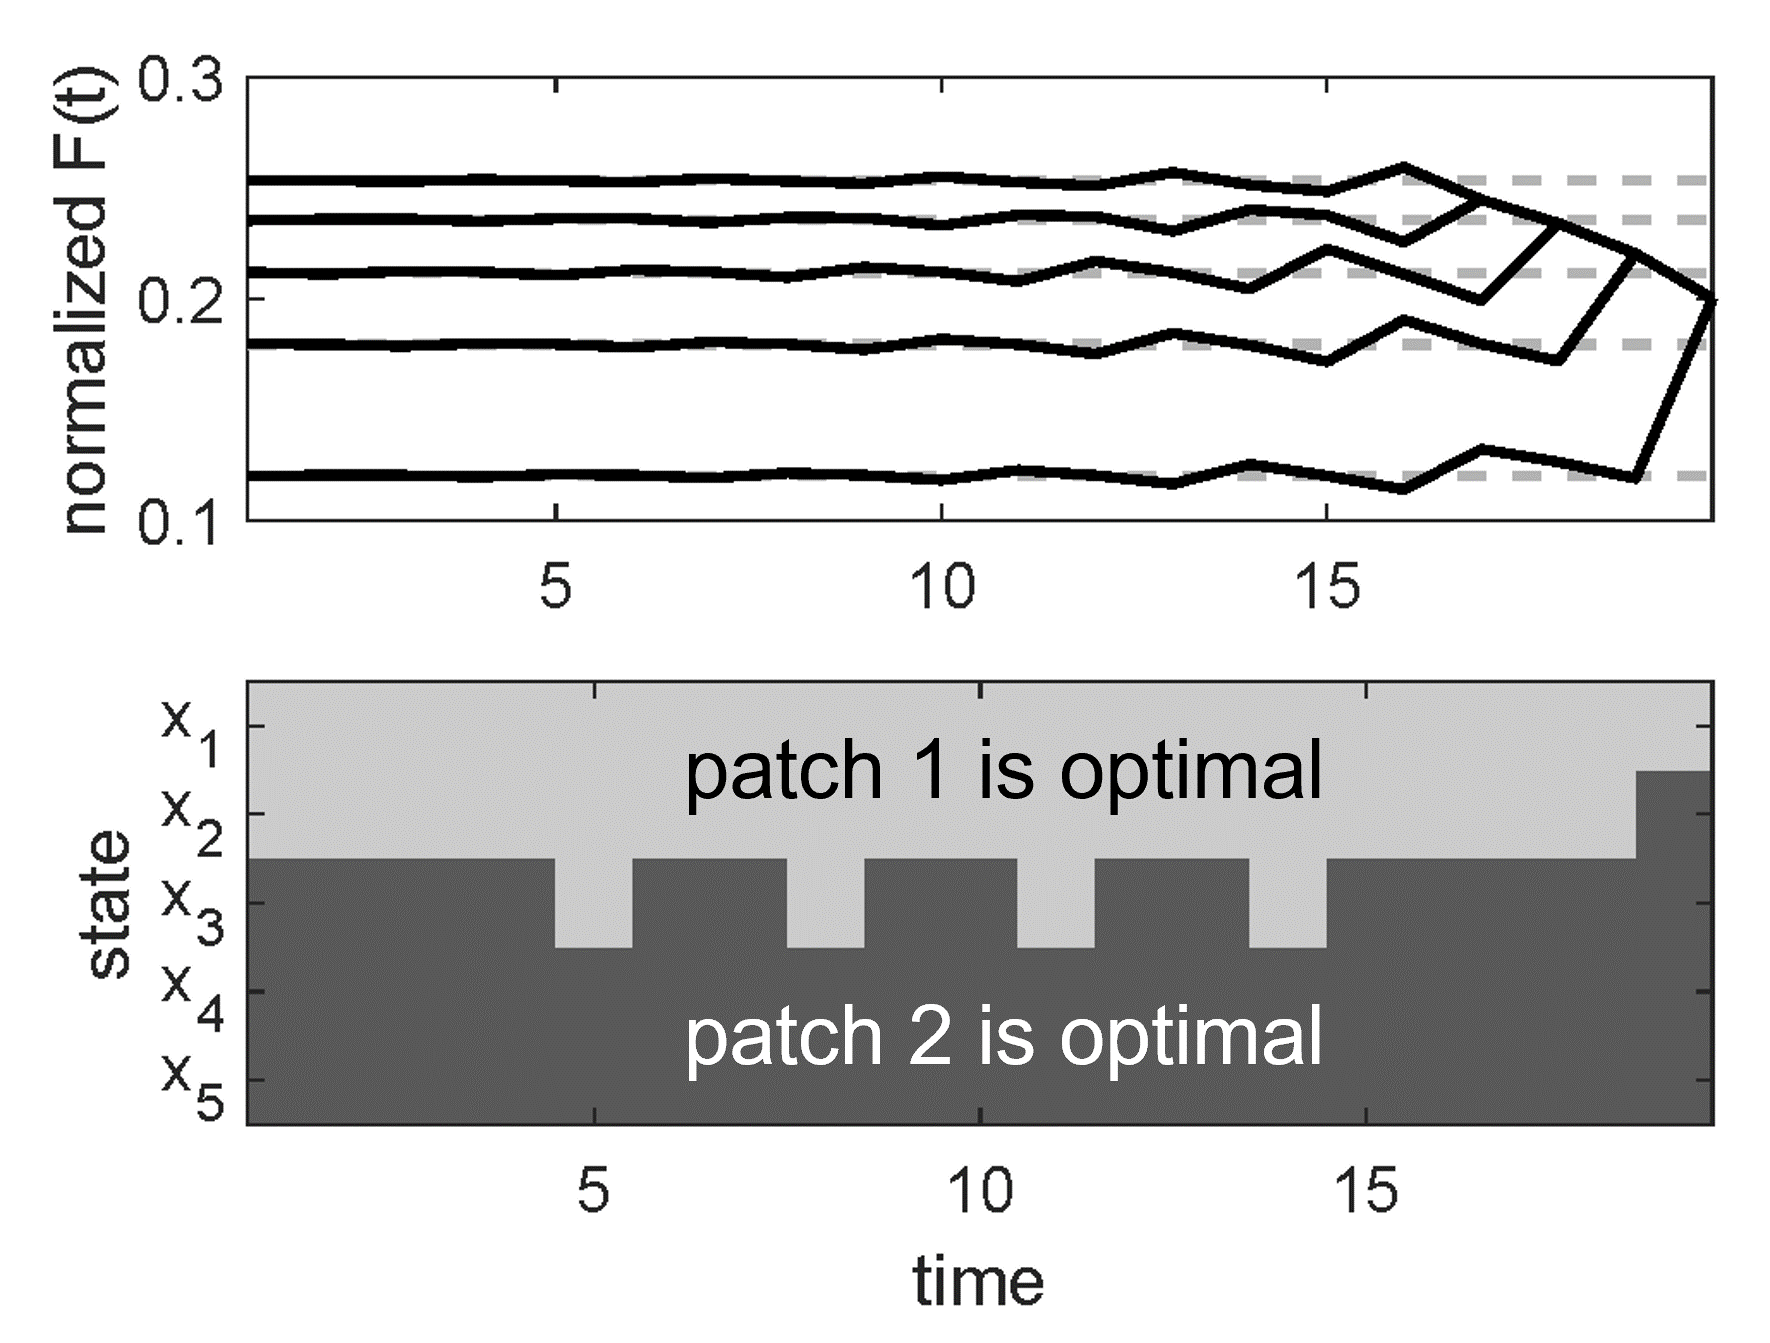
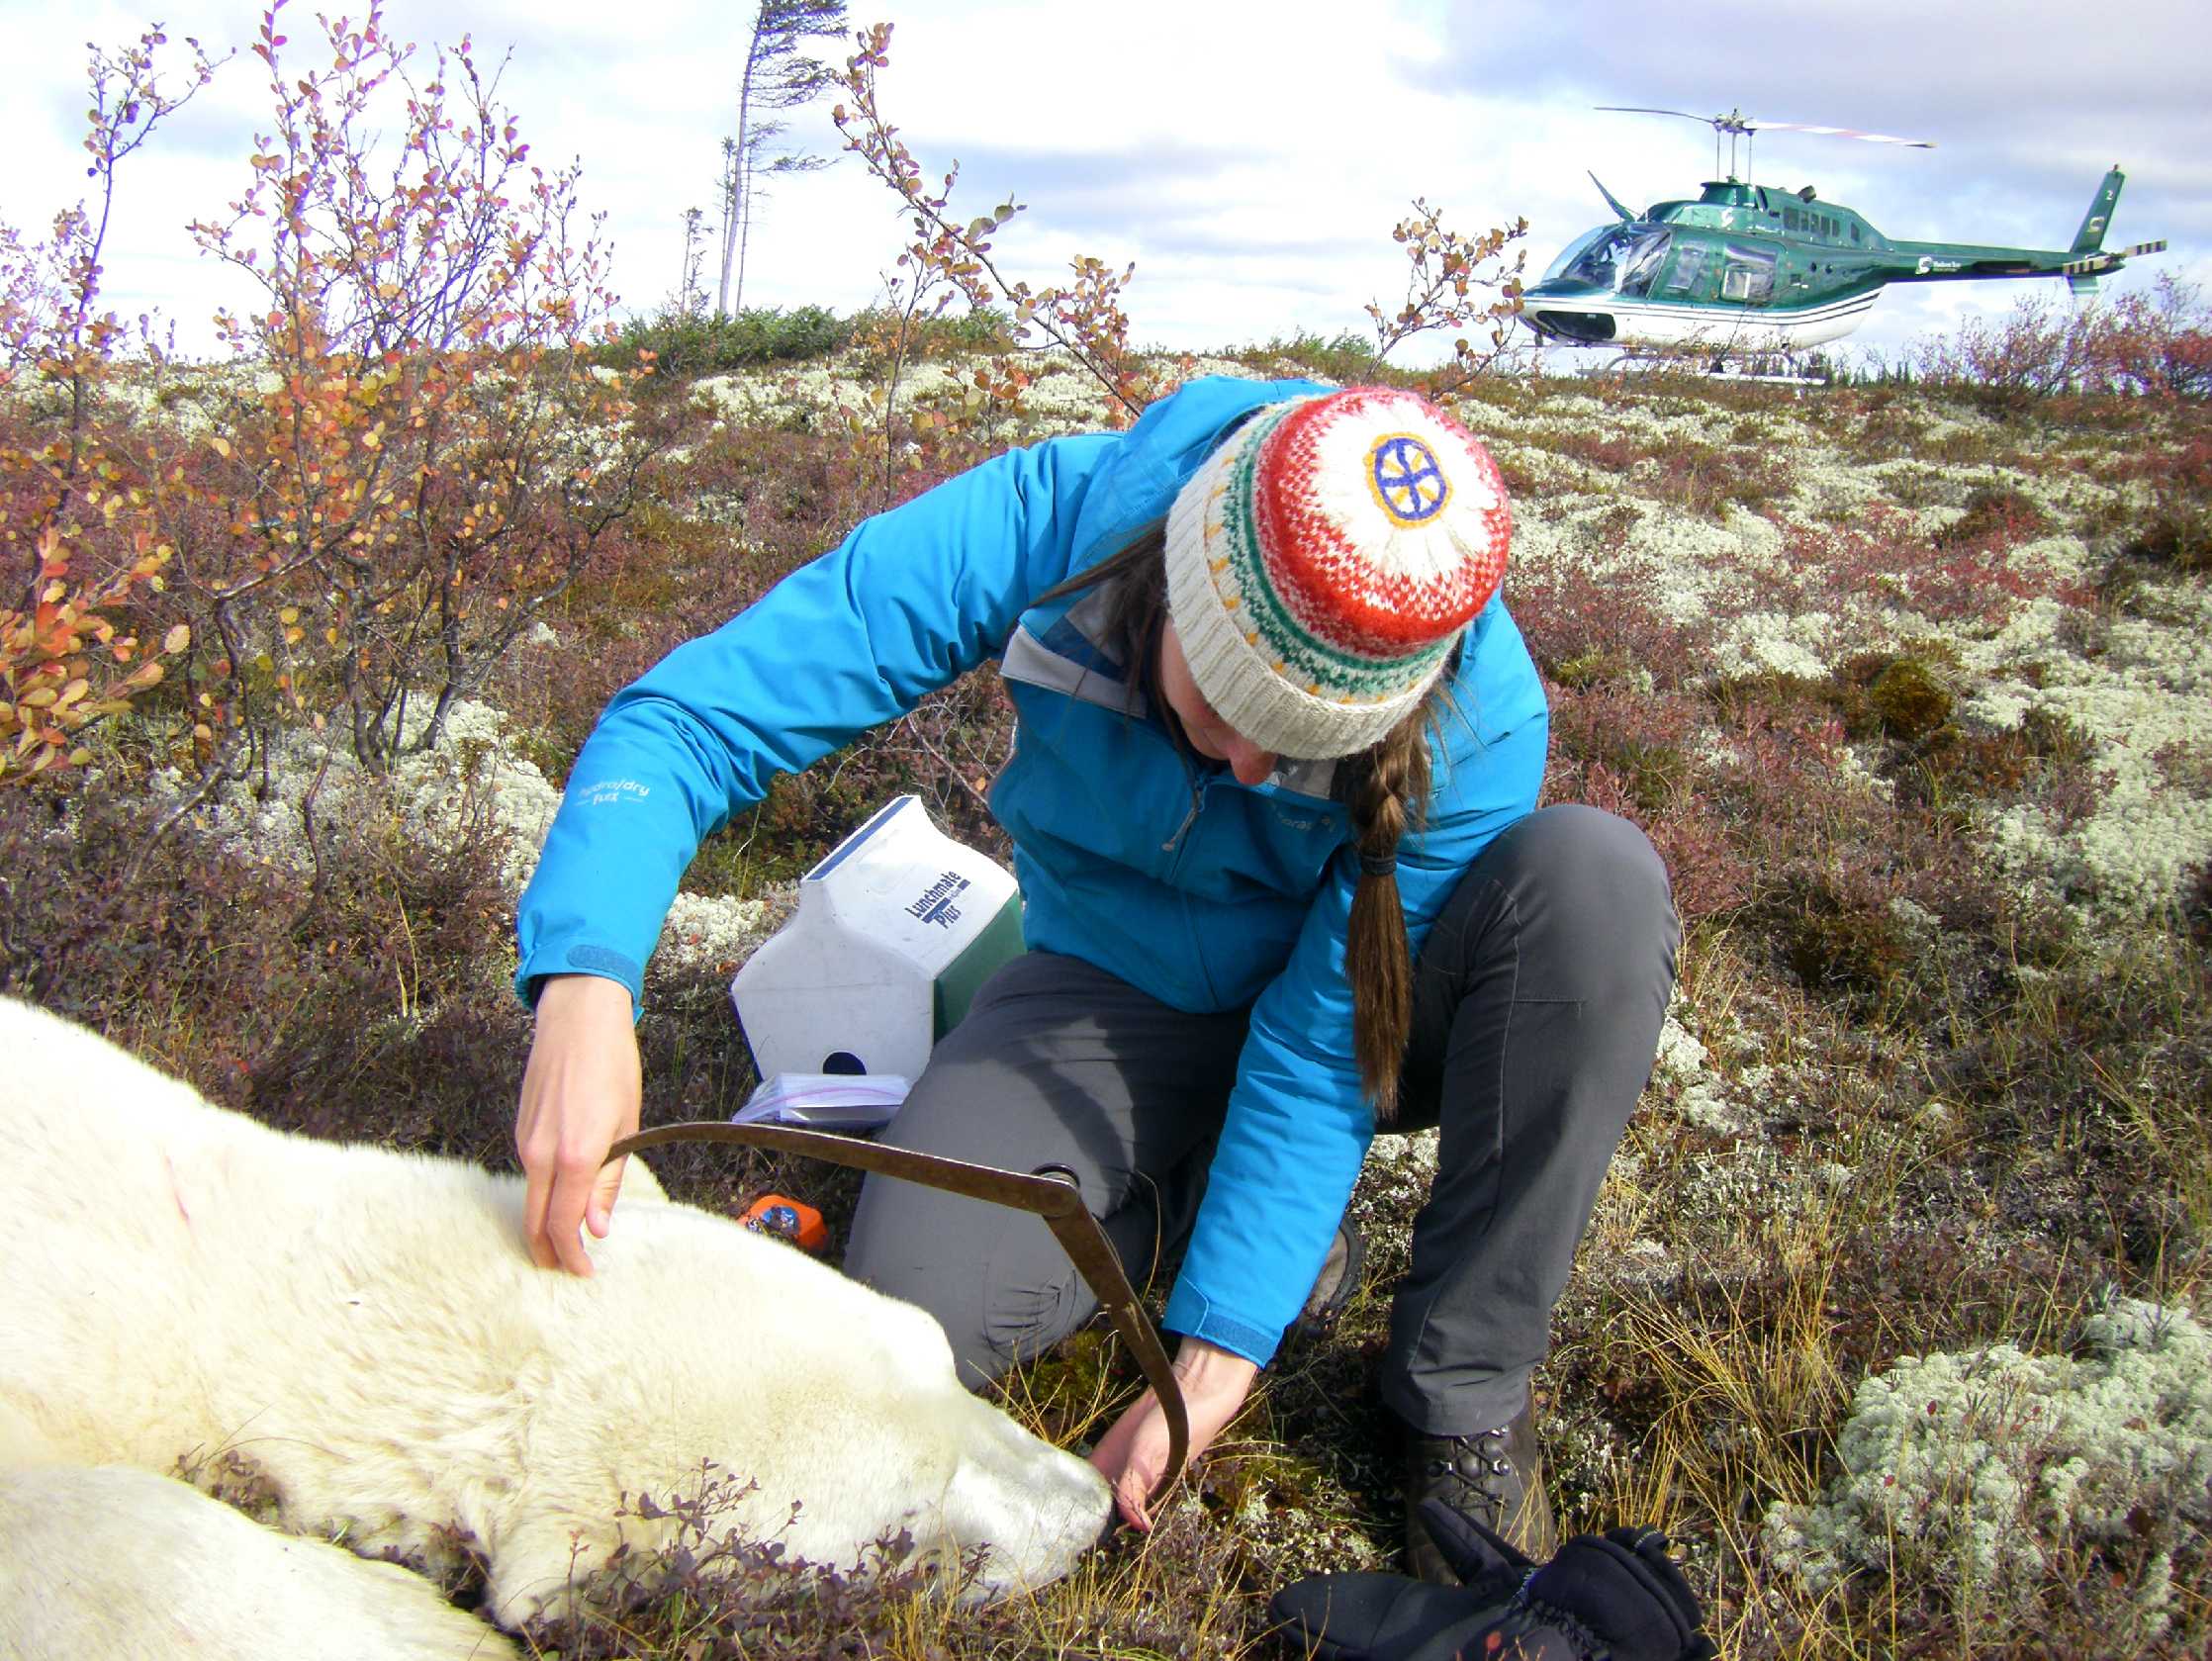
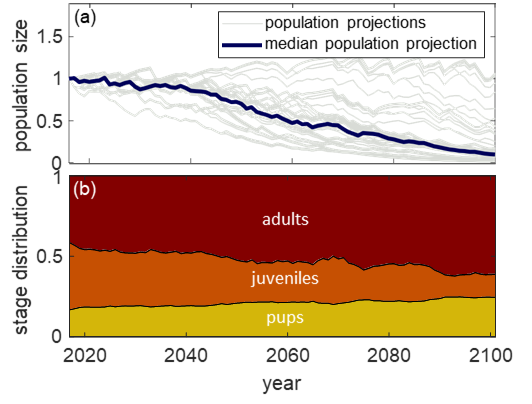
Left: two plots showing oscillatory behaviour in a stochastic dynamic programming (SDP) model of polar bear foraging. In the top plot, oscillations "backwards" in time can be seen in a vector representing the bear's lifetime fitness. In the bottom plot, corresponding oscillations are seen to occur in the optimal foraging habitat predicted for the bear. An understanding of the matrix structure of SDP models allows for intuition from a different branch of mathematical ecology (matrix population models)to explain these nonintuitive oscillations (see publications [7] and [8]). Middle: measuring polar bear skull length in the field, Churchill, MB, Canada (photo: E. Richardson). Optimal control theoretic approaches such as stochastic dynamic programming models provide insight into how individual polar bear behaviour might change in a warmer Arctic, and the implications of those changes on lifetime reproductive success. Right: age-structured population models can help understand not only how ringed seal population size might change over time (a), but also concurrent changes in population structure, which are easier to detect (b) (publication [6]).
Other collaborative projects
We also enjoy working on on collaborative, interdisciplinary projects with biologists, statisticians, and applied mathematicians with a wide range of mathematical approaches and biological applications. Some of these projects focus on general ecological theory, including ongoing work on the impact of stochasticity on so-called long transient dynamics. Other projects are system specific, integrating field data with models to understand questions such as: "Can we track songbird breeding success by monitoring their singing?", "Can data on snowshoe hare body size help us determine the timing of lynx-hare population cycles?", or "Can changes in elk gps tracks help us detect shifts in calving timing and location?". Interesting questions using optimal control theory arise from a desire to achieve management objectives, whether management of infectious diseases (e.g., HPV or COVID-19 ), or wildlife .
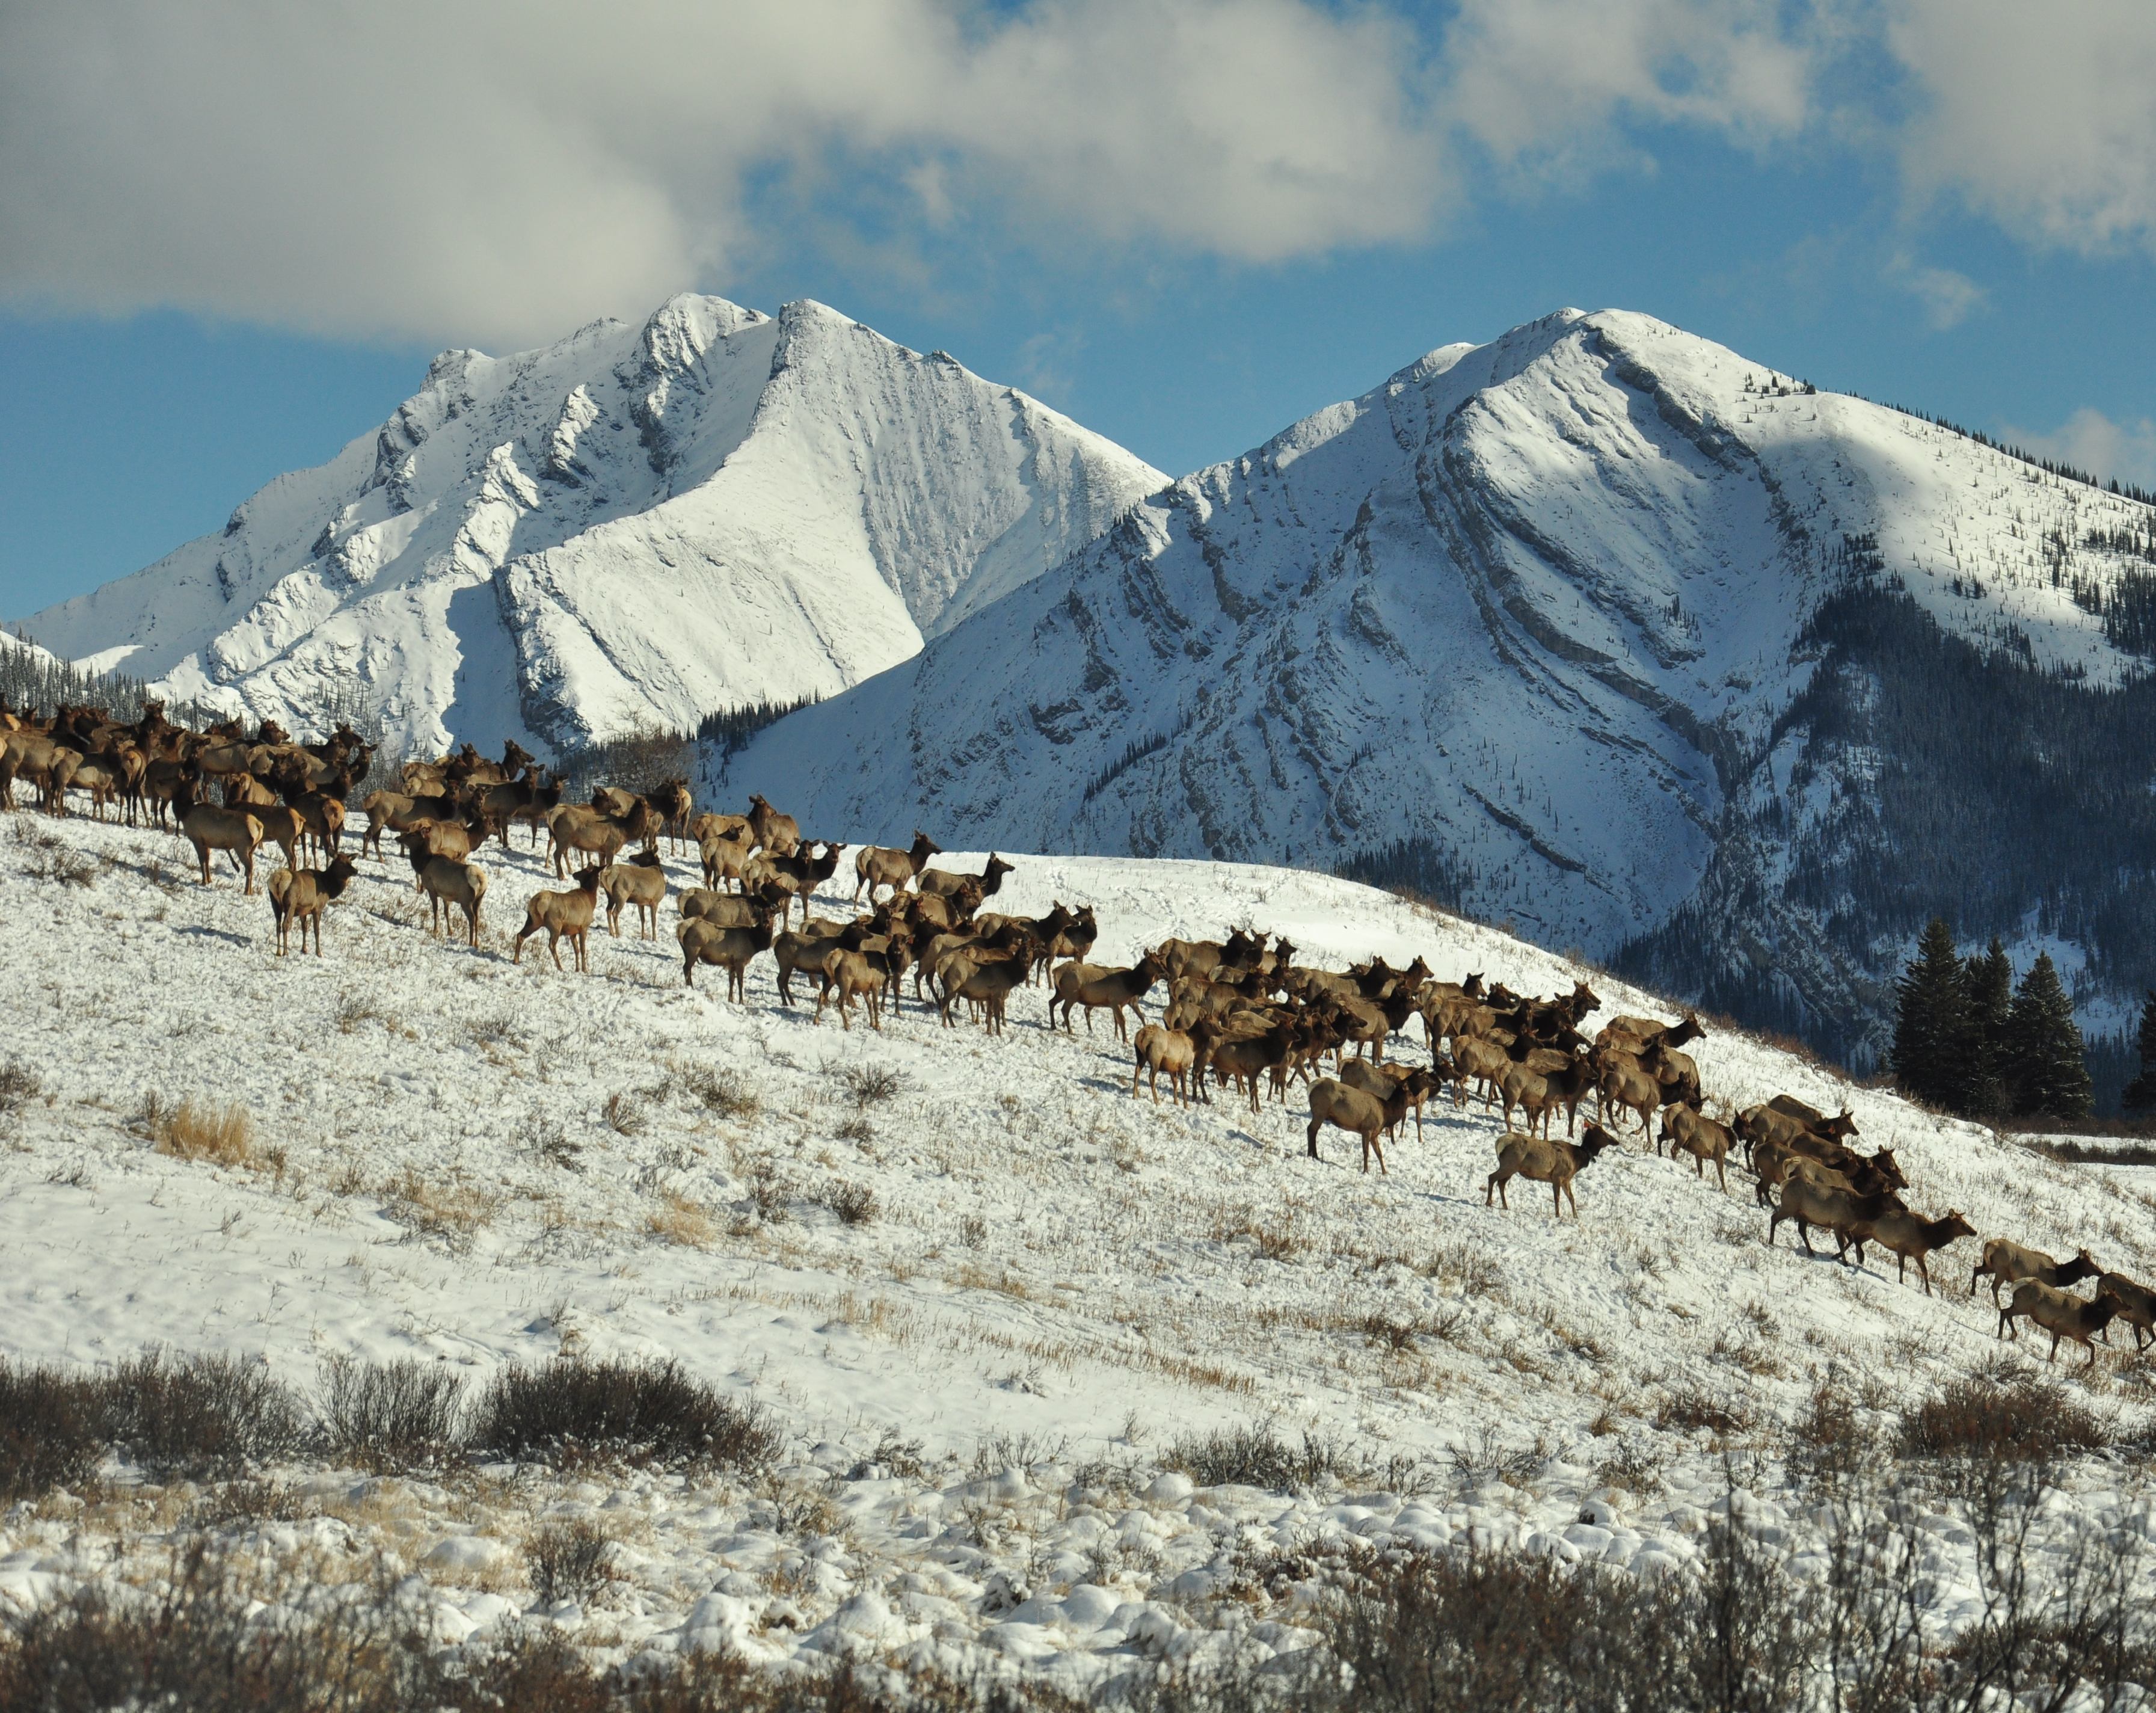
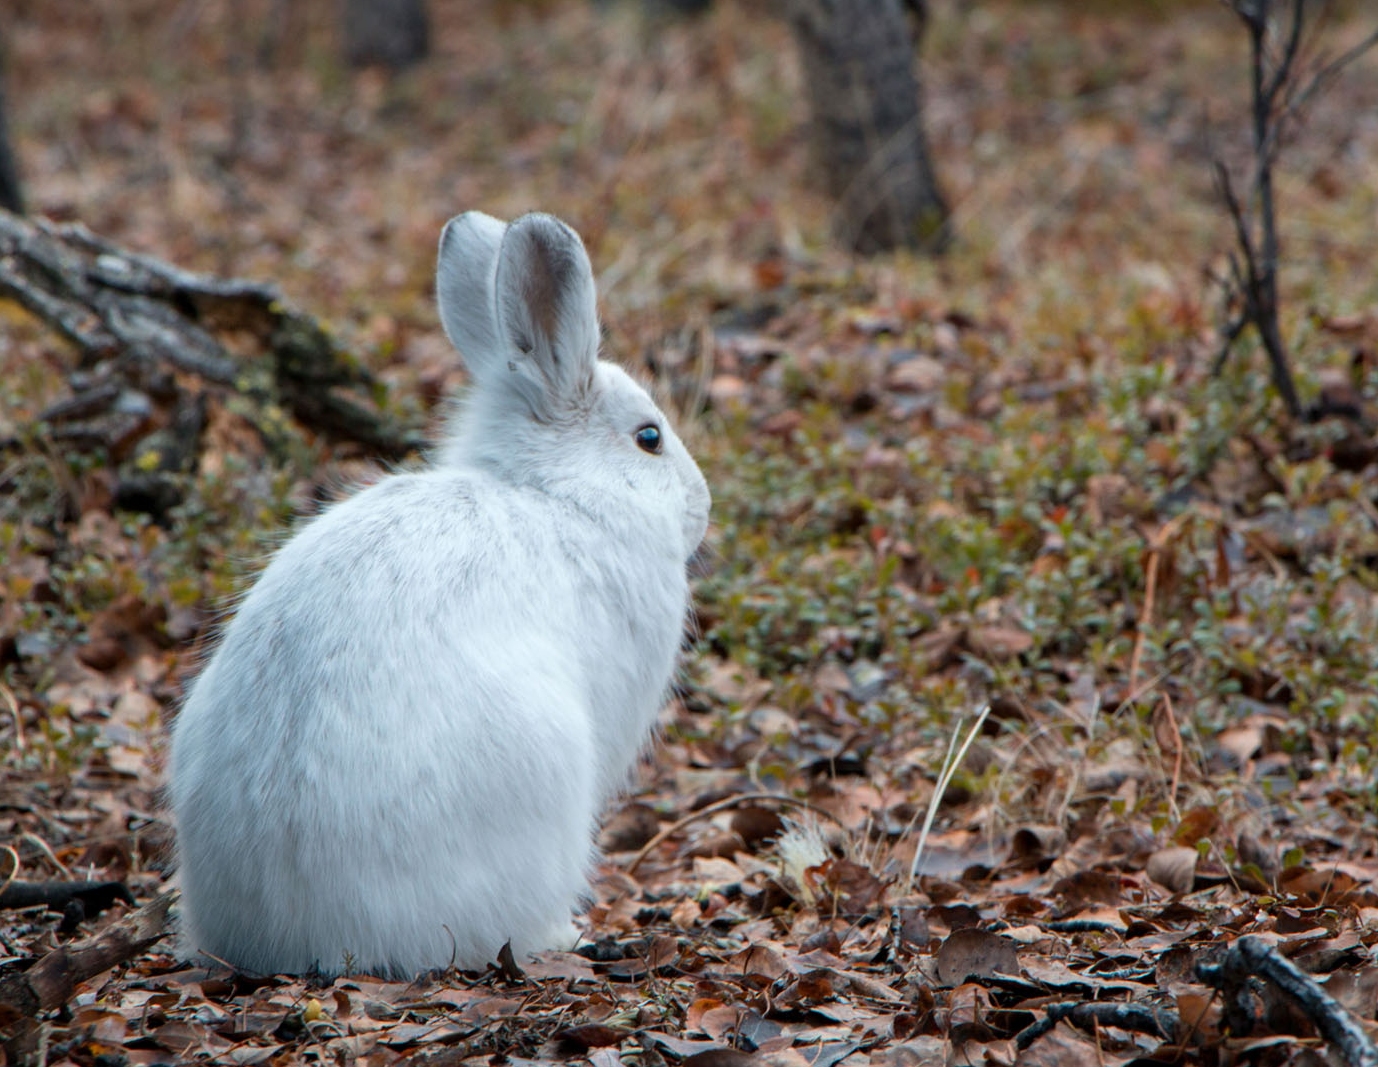
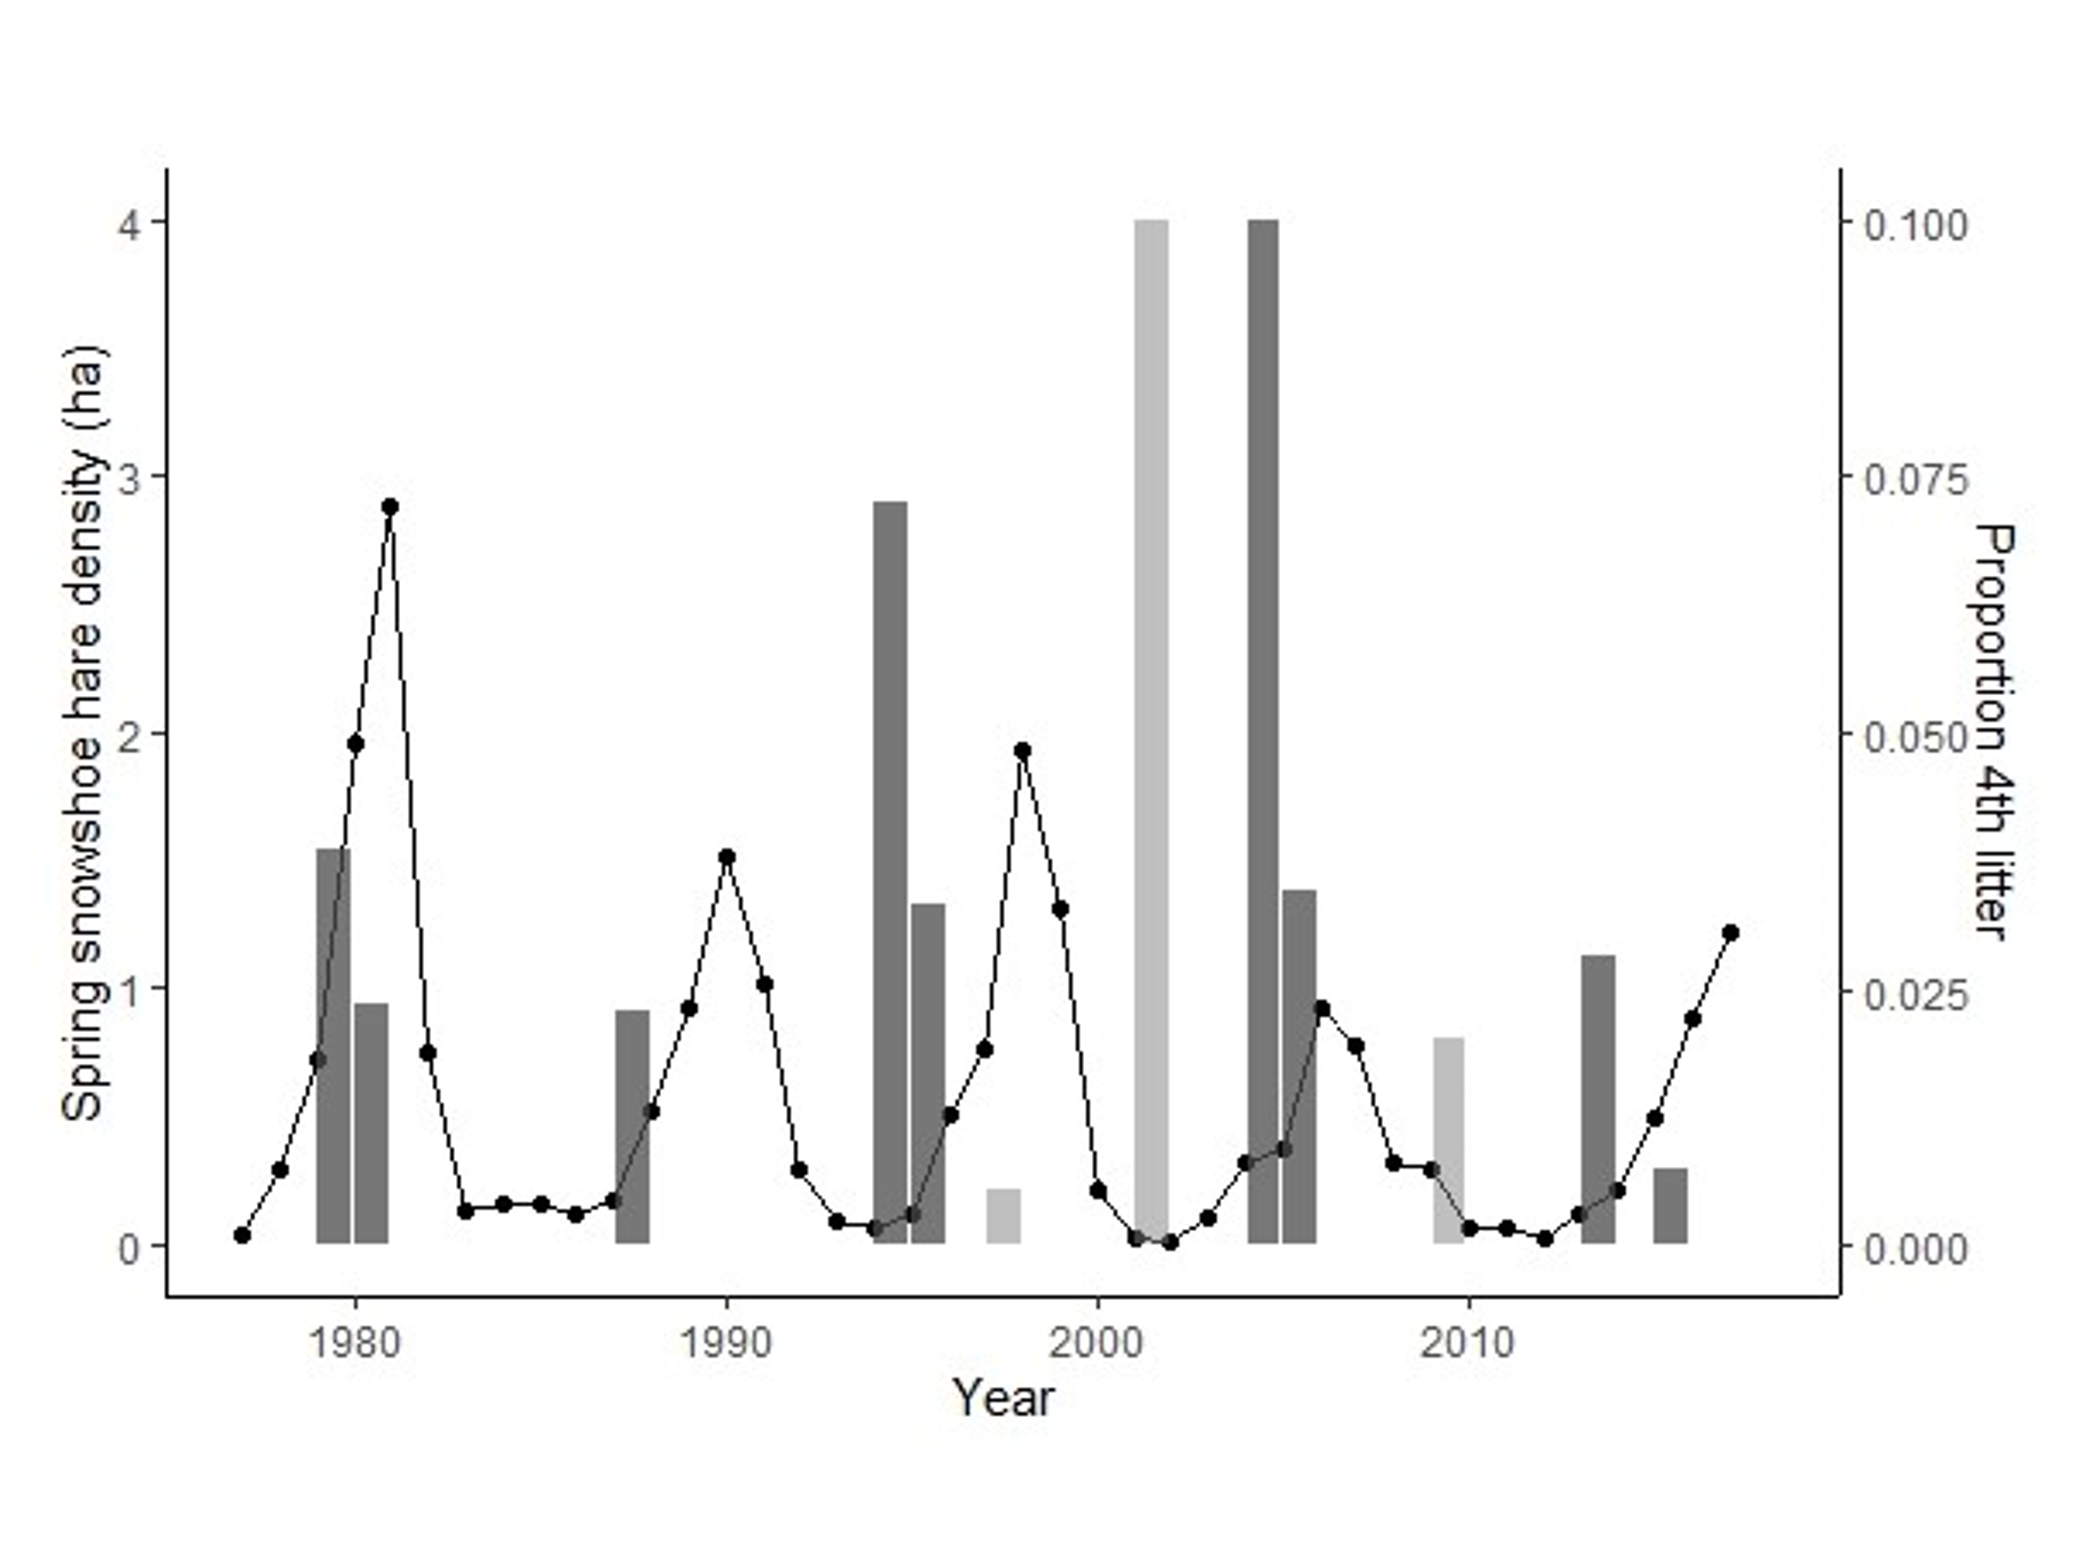
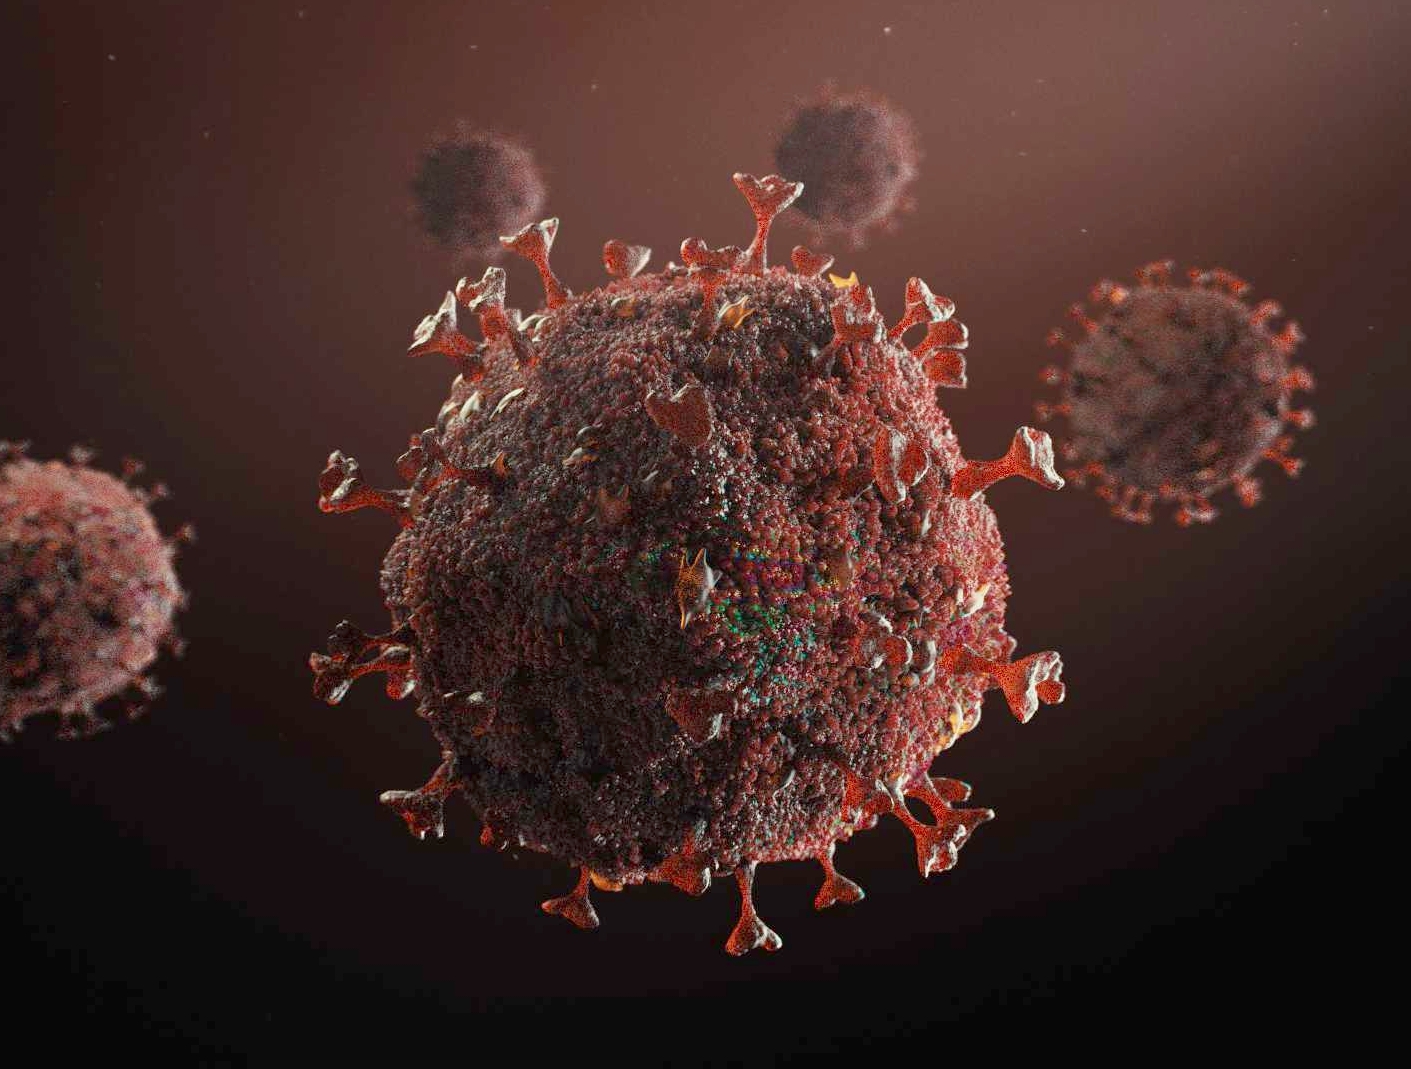
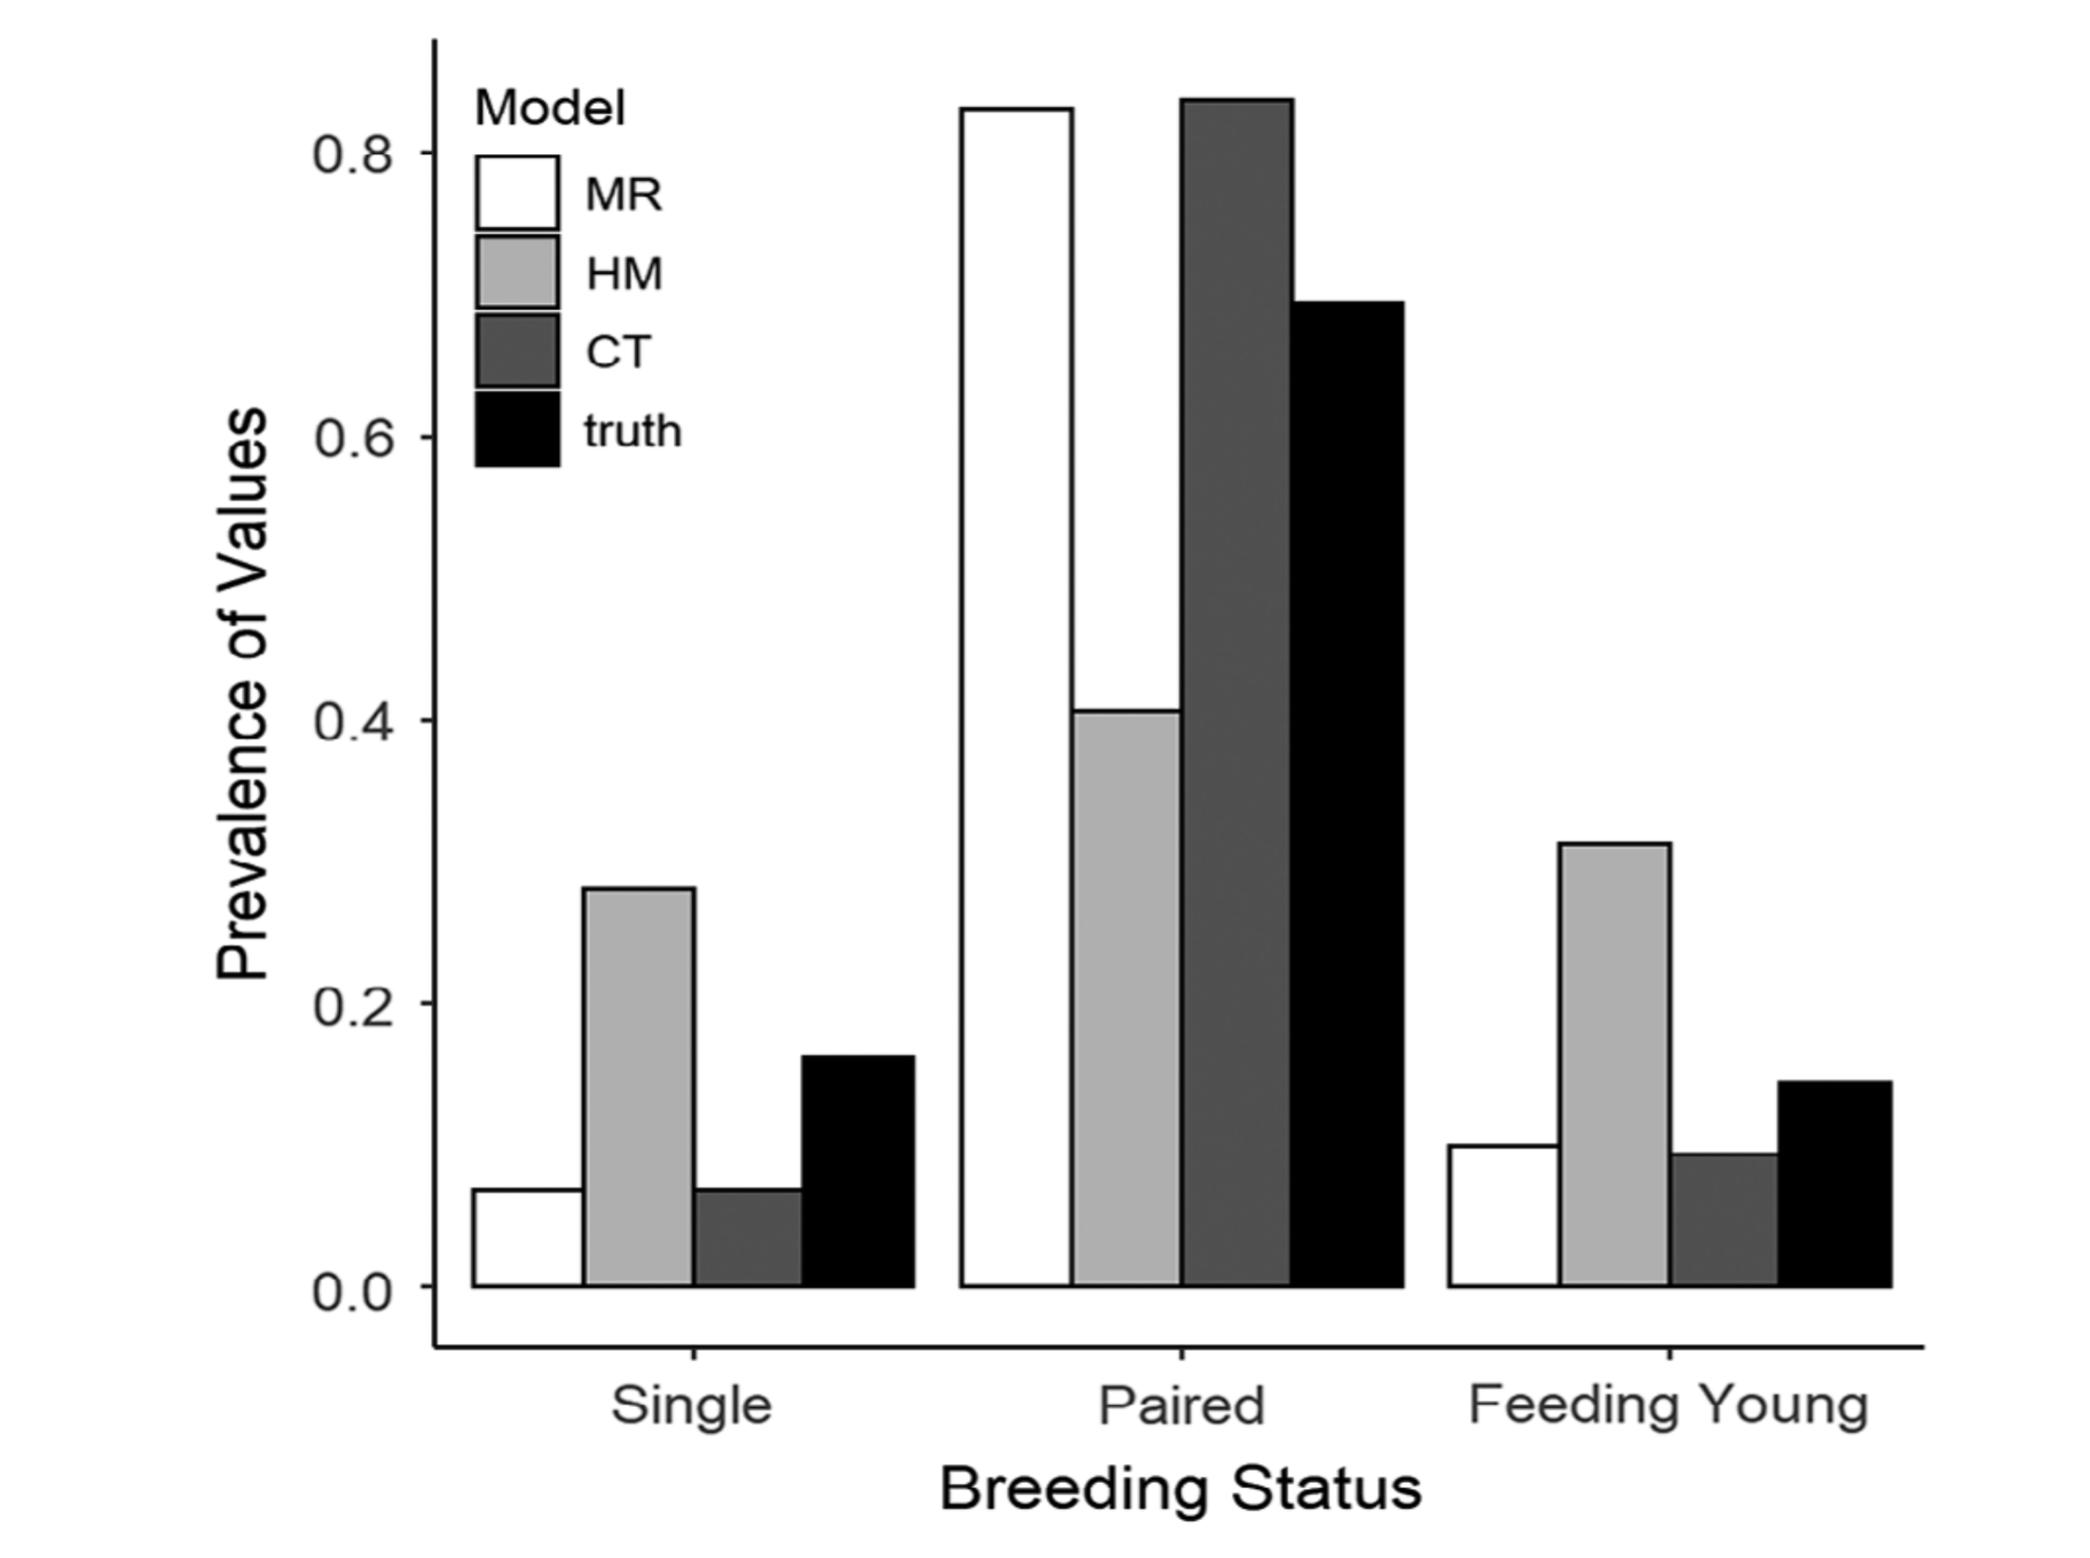
Top Left: elk at Ya Ha Tinda ranch, AB, Canada (photo: J. Berg). Using a machine learning approach, we can determine when and where female elk gave birth, based on changes in individual movement patterns [15]. Top middle: consideration of how adding white noise to a model with long transient dynamics (the purple curve) shortens the time the systems spends in its transient state [16]. Top right: a snowshoe hare, YK, Canada (photo: M. Peers). Bottom left: by fitting growth curves to snowshoe hare size data, we were able to connect years with an additional (4th) litter to hare population cycles, and explore the implications of this additional litter as a possible driver of these cycles [14]. Bottom middle: working with a team of clinicians and statisticians, we paired a "clinical prediction rule" (CPR; which predicts someone's probability of having a positive test result) with a stochastic compartmental model of COVID-19. This allowed us to demonstrate the impact of prioritizing testing of those most likely to test positive, in scenarios with limited testing capacity [13]. Bottom right: comparison between three possible calibration models (multinomial logistic regression, a Bayesian hierarchical model, and a classification tree) attempting to predict songbird breeding status by listening to their song count [9].