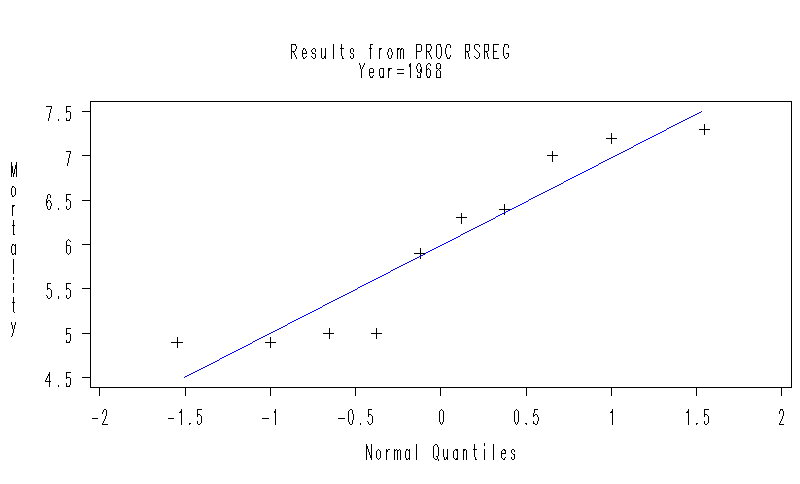
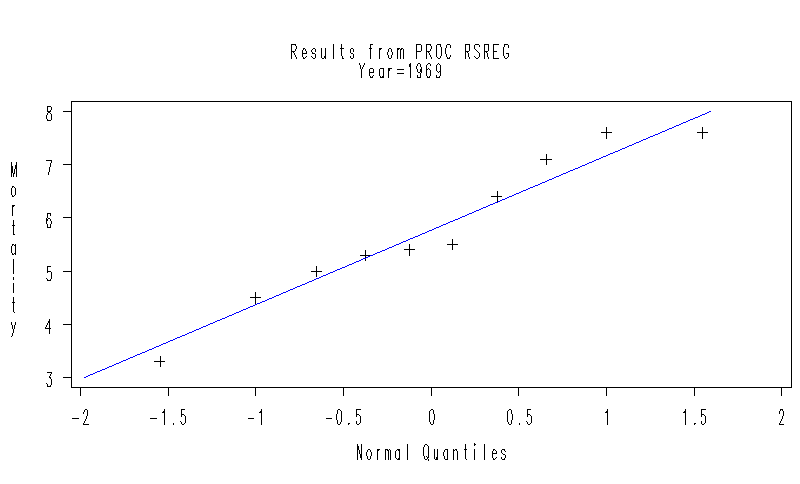
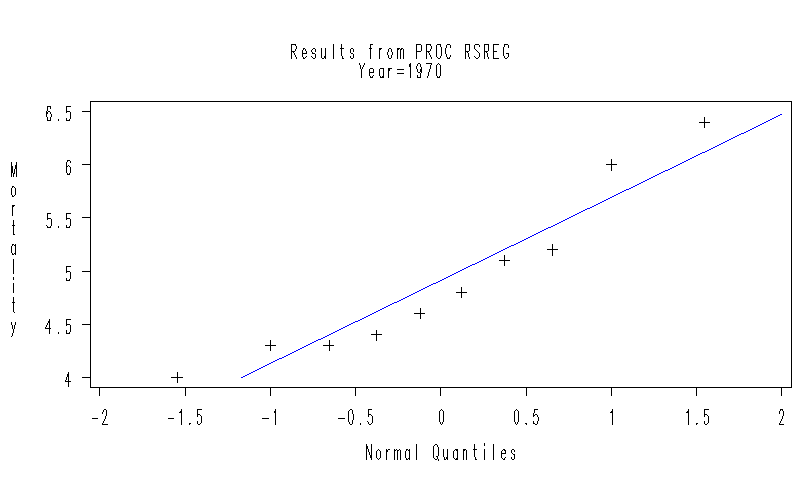
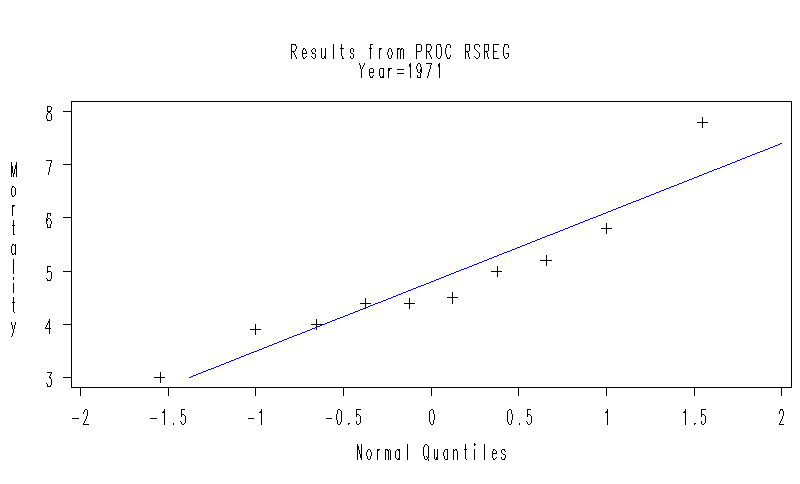
The SAS System |
Year | ||||||
---|---|---|---|---|---|---|
1968 | 1969 | 1970 | 1971 | 1972 | ||
Mortality | Std | 0.99 | 1.40 | 0.78 | 1.30 | 0.95 |
Mean | 5.99 | 5.77 | 4.91 | 4.80 | 4.72 |
The SAS System |
Class Level Information | ||
---|---|---|
Class | Levels | Values |
Year | 5 | 1968 1969 1970 1971 1972 |
Number of Observations Read | 50 |
---|---|
Number of Observations Used | 50 |
The SAS System |
Source | DF | Sum of Squares | Mean Square | F Value | Pr > F |
---|---|---|---|---|---|
Model | 4 | 14.16280000 | 3.54070000 | 2.88 | 0.0331 |
Error | 45 | 55.31500000 | 1.22922222 | ||
Corrected Total | 49 | 69.47780000 |
R-Square | Coeff Var | Root MSE | Mortality Mean |
---|---|---|---|
0.203846 | 21.16653 | 1.108703 | 5.238000 |
Source | DF | Type I SS | Mean Square | F Value | Pr > F |
---|---|---|---|---|---|
Year | 4 | 14.16280000 | 3.54070000 | 2.88 | 0.0331 |
Source | DF | Type III SS | Mean Square | F Value | Pr > F |
---|---|---|---|---|---|
Year | 4 | 14.16280000 | 3.54070000 | 2.88 | 0.0331 |
The SAS System |
Note: | This test controls the Type I comparisonwise error rate, not the experimentwise error rate. |
Alpha | 0.05 |
---|---|
Error Degrees of Freedom | 45 |
Error Mean Square | 1.229222 |
Critical Value of t | 2.01410 |
Least Significant Difference | 0.9986 |
Means with the same letter are not significantly different. |
||||
---|---|---|---|---|
t Grouping | Mean | N | Year | |
A | 5.9900 | 10 | 1968 | |
A | ||||
B | A | 5.7700 | 10 | 1969 |
B | ||||
B | C | 4.9100 | 10 | 1970 |
B | C | |||
B | C | 4.8000 | 10 | 1971 |
C | ||||
C | 4.7200 | 10 | 1972 |
The SAS System |
Note: | This test controls the Type I comparisonwise error rate, not the experimentwise error rate. |
Alpha | 0.05 |
---|---|
Error Degrees of Freedom | 45 |
Error Mean Square | 1.229222 |
Number of Means | 2 | 3 | 4 | 5 |
---|---|---|---|---|
Critical Range | 0.999 | 1.050 | 1.084 | 1.108 |
Means with the same letter are not significantly different. |
||||
---|---|---|---|---|
Duncan Grouping | Mean | N | Year | |
A | 5.9900 | 10 | 1968 | |
A | ||||
B | A | 5.7700 | 10 | 1969 |
B | ||||
B | 4.9100 | 10 | 1970 | |
B | ||||
B | 4.8000 | 10 | 1971 | |
B | ||||
B | 4.7200 | 10 | 1972 |
The SAS System |
Bartlett's Test for Homogeneity of Mortality Variance |
|||
---|---|---|---|
Source | DF | Chi-Square | Pr > ChiSq |
Year | 4 | 3.8867 | 0.4216 |
The SAS System |
Level of Year |
N | Mortality | |
---|---|---|---|
Mean | Std Dev | ||
1968 | 10 | 5.99000000 | 0.98933199 |
1969 | 10 | 5.77000000 | 1.39845152 |
1970 | 10 | 4.91000000 | 0.77952977 |
1971 | 10 | 4.80000000 | 1.30384048 |
1972 | 10 | 4.72000000 | 0.95078915 |
The SAS System |
Levene's Test for Homogeneity of Mortality Variance ANOVA of Squared Deviations from Group Means |
|||||
---|---|---|---|---|---|
Source | DF | Sum of Squares | Mean Square | F Value | Pr > F |
Year | 4 | 10.5638 | 2.6410 | 0.97 | 0.4329 |
Error | 45 | 122.4 | 2.7206 |
The SAS System |
Level of Year |
N | Mortality | |
---|---|---|---|
Mean | Std Dev | ||
1968 | 10 | 5.99000000 | 0.98933199 |
1969 | 10 | 5.77000000 | 1.39845152 |
1970 | 10 | 4.91000000 | 0.77952977 |
1971 | 10 | 4.80000000 | 1.30384048 |
1972 | 10 | 4.72000000 | 0.95078915 |
The SAS System |
O'Brien's Test for Homogeneity of Mortality Variance ANOVA of O'Brien's Spread Variable, W = 0.5 |
|||||
---|---|---|---|---|---|
Source | DF | Sum of Squares | Mean Square | F Value | Pr > F |
Year | 4 | 13.0418 | 3.2604 | 0.86 | 0.4953 |
Error | 45 | 170.6 | 3.7918 |
The SAS System |
Level of Year |
N | Mortality | |
---|---|---|---|
Mean | Std Dev | ||
1968 | 10 | 5.99000000 | 0.98933199 |
1969 | 10 | 5.77000000 | 1.39845152 |
1970 | 10 | 4.91000000 | 0.77952977 |
1971 | 10 | 4.80000000 | 1.30384048 |
1972 | 10 | 4.72000000 | 0.95078915 |
The SAS System |
Brown and Forsythe's Test for Homogeneity of Mortality Variance ANOVA of Absolute Deviations from Group Medians |
|||||
---|---|---|---|---|---|
Source | DF | Sum of Squares | Mean Square | F Value | Pr > F |
Year | 4 | 1.2788 | 0.3197 | 0.60 | 0.6627 |
Error | 45 | 23.8750 | 0.5306 |
The SAS System |
Level of Year |
N | Mortality | |
---|---|---|---|
Mean | Std Dev | ||
1968 | 10 | 5.99000000 | 0.98933199 |
1969 | 10 | 5.77000000 | 1.39845152 |
1970 | 10 | 4.91000000 | 0.77952977 |
1971 | 10 | 4.80000000 | 1.30384048 |
1972 | 10 | 4.72000000 | 0.95078915 |
The SAS System |
Contrast | DF | Contrast SS | Mean Square | F Value | Pr > F |
---|---|---|---|---|---|
Linear | 1 | 12.32010000 | 12.32010000 | 10.02 | 0.0028 |
Quadratic | 1 | 0.75778571 | 0.75778571 | 0.62 | 0.4365 |
The SAS System |
Results from PROC RSREG |
Coding Coefficients for the Independent Variables |
||
---|---|---|
Factor | Subtracted off | Divided by |
Year | 1970.000000 | 2.000000 |
Response Surface for Variable Mortality | |
---|---|
Response Mean | 5.238000 |
Root MSE | 1.095444 |
R-Square | 0.1882 |
Coefficient of Variation | 20.9134 |
Regression | DF | Type I Sum of Squares | R-Square | F Value | Pr > F |
---|---|---|---|---|---|
Linear | 1 | 12.320100 | 0.1773 | 10.27 | 0.0024 |
Quadratic | 1 | 0.757786 | 0.0109 | 0.63 | 0.4308 |
Crossproduct | 0 | 0 | 0.0000 | . | . |
Total Model | 2 | 13.077886 | 0.1882 | 5.45 | 0.0074 |
Residual | DF | Sum of Squares | Mean Square | F Value | Pr > F |
---|---|---|---|---|---|
Lack of Fit | 2 | 1.084914 | 0.542457 | 0.44 | 0.6460 |
Pure Error | 45 | 55.315000 | 1.229222 | ||
Total Error | 47 | 56.399914 | 1.199998 |
Parameter | DF | Estimate | Standard Error | t Value | Pr > |t| | Parameter Estimate from Coded Data |
---|---|---|---|---|---|---|
Intercept | 1 | 286220 | 359301 | 0.80 | 0.4297 | 5.090857 |
Year | 1 | -290.222429 | 364.772859 | -0.80 | 0.4303 | -0.702000 |
Year*Year | 1 | 0.073571 | 0.092582 | 0.79 | 0.4308 | 0.294286 |
Factor | DF | Sum of Squares | Mean Square | F Value | Pr > F |
---|---|---|---|---|---|
Year | 2 | 13.077886 | 6.538943 | 5.45 | 0.0074 |
The SAS System |
Results from PROC RSREG |
Moments | |||
---|---|---|---|
N | 10 | Sum Weights | 10 |
Mean | 5.99 | Sum Observations | 59.9 |
Std Deviation | 0.98933199 | Variance | 0.97877778 |
Skewness | 0.08853675 | Kurtosis | -1.8535056 |
Uncorrected SS | 367.61 | Corrected SS | 8.809 |
Coeff Variation | 16.5163937 | Std Error Mean | 0.31285424 |
Basic Statistical Measures | |||
---|---|---|---|
Location | Variability | ||
Mean | 5.990000 | Std Deviation | 0.98933 |
Median | 6.100000 | Variance | 0.97878 |
Mode | 4.900000 | Range | 2.40000 |
Interquartile Range | 2.00000 |
Note: | The mode displayed is the smallest of 2 modes with a count of 2. |
Tests for Location: Mu0=0 | ||||
---|---|---|---|---|
Test | Statistic | p Value | ||
Student's t | t | 19.1463 | Pr > |t| | <.0001 |
Sign | M | 5 | Pr >= |M| | 0.0020 |
Signed Rank | S | 27.5 | Pr >= |S| | 0.0020 |
Tests for Normality | ||||
---|---|---|---|---|
Test | Statistic | p Value | ||
Shapiro-Wilk | W | 0.858614 | Pr < W | 0.0735 |
Kolmogorov-Smirnov | D | 0.241508 | Pr > D | 0.0953 |
Cramer-von Mises | W-Sq | 0.079161 | Pr > W-Sq | 0.1964 |
Anderson-Darling | A-Sq | 0.557215 | Pr > A-Sq | 0.1139 |
Quantiles (Definition 5) | |
---|---|
Quantile | Estimate |
100% Max | 7.30 |
99% | 7.30 |
95% | 7.30 |
90% | 7.25 |
75% Q3 | 7.00 |
50% Median | 6.10 |
25% Q1 | 5.00 |
10% | 4.90 |
5% | 4.90 |
1% | 4.90 |
0% Min | 4.90 |
Extreme Observations | |||
---|---|---|---|
Lowest | Highest | ||
Value | Obs | Value | Obs |
4.9 | 7 | 6.3 | 9 |
4.9 | 2 | 6.4 | 8 |
5.0 | 4 | 7.0 | 6 |
5.0 | 1 | 7.2 | 5 |
5.9 | 3 | 7.3 | 10 |
The SAS System |
Results from PROC RSREG |
Moments | |||
---|---|---|---|
N | 10 | Sum Weights | 10 |
Mean | 5.77 | Sum Observations | 57.7 |
Std Deviation | 1.39845152 | Variance | 1.95566667 |
Skewness | -0.1466961 | Kurtosis | -0.5750493 |
Uncorrected SS | 350.53 | Corrected SS | 17.601 |
Coeff Variation | 24.2365949 | Std Error Mean | 0.4422292 |
Basic Statistical Measures | |||
---|---|---|---|
Location | Variability | ||
Mean | 5.770000 | Std Deviation | 1.39845 |
Median | 5.450000 | Variance | 1.95567 |
Mode | 7.600000 | Range | 4.30000 |
Interquartile Range | 2.10000 |
Tests for Location: Mu0=0 | ||||
---|---|---|---|---|
Test | Statistic | p Value | ||
Student's t | t | 13.04753 | Pr > |t| | <.0001 |
Sign | M | 5 | Pr >= |M| | 0.0020 |
Signed Rank | S | 27.5 | Pr >= |S| | 0.0020 |
Tests for Normality | ||||
---|---|---|---|---|
Test | Statistic | p Value | ||
Shapiro-Wilk | W | 0.943907 | Pr < W | 0.5972 |
Kolmogorov-Smirnov | D | 0.176548 | Pr > D | >0.1500 |
Cramer-von Mises | W-Sq | 0.042347 | Pr > W-Sq | >0.2500 |
Anderson-Darling | A-Sq | 0.27439 | Pr > A-Sq | >0.2500 |
Quantiles (Definition 5) | |
---|---|
Quantile | Estimate |
100% Max | 7.60 |
99% | 7.60 |
95% | 7.60 |
90% | 7.60 |
75% Q3 | 7.10 |
50% Median | 5.45 |
25% Q1 | 5.00 |
10% | 3.90 |
5% | 3.30 |
1% | 3.30 |
0% Min | 3.30 |
Extreme Observations | |||
---|---|---|---|
Lowest | Highest | ||
Value | Obs | Value | Obs |
3.3 | 12 | 5.5 | 14 |
4.5 | 13 | 6.4 | 18 |
5.0 | 15 | 7.1 | 20 |
5.3 | 19 | 7.6 | 16 |
5.4 | 11 | 7.6 | 17 |
The SAS System |
Results from PROC RSREG |
Moments | |||
---|---|---|---|
N | 10 | Sum Weights | 10 |
Mean | 4.91 | Sum Observations | 49.1 |
Std Deviation | 0.77952977 | Variance | 0.60766667 |
Skewness | 0.95670008 | Kurtosis | 0.0277596 |
Uncorrected SS | 246.55 | Corrected SS | 5.469 |
Coeff Variation | 15.8763701 | Std Error Mean | 0.24650896 |
Basic Statistical Measures | |||
---|---|---|---|
Location | Variability | ||
Mean | 4.910000 | Std Deviation | 0.77953 |
Median | 4.700000 | Variance | 0.60767 |
Mode | 4.300000 | Range | 2.40000 |
Interquartile Range | 0.90000 |
Tests for Location: Mu0=0 | ||||
---|---|---|---|---|
Test | Statistic | p Value | ||
Student's t | t | 19.91814 | Pr > |t| | <.0001 |
Sign | M | 5 | Pr >= |M| | 0.0020 |
Signed Rank | S | 27.5 | Pr >= |S| | 0.0020 |
Tests for Normality | ||||
---|---|---|---|---|
Test | Statistic | p Value | ||
Shapiro-Wilk | W | 0.90363 | Pr < W | 0.2400 |
Kolmogorov-Smirnov | D | 0.156109 | Pr > D | >0.1500 |
Cramer-von Mises | W-Sq | 0.069106 | Pr > W-Sq | >0.2500 |
Anderson-Darling | A-Sq | 0.435813 | Pr > A-Sq | 0.2409 |
Quantiles (Definition 5) | |
---|---|
Quantile | Estimate |
100% Max | 6.40 |
99% | 6.40 |
95% | 6.40 |
90% | 6.20 |
75% Q3 | 5.20 |
50% Median | 4.70 |
25% Q1 | 4.30 |
10% | 4.15 |
5% | 4.00 |
1% | 4.00 |
0% Min | 4.00 |
Extreme Observations | |||
---|---|---|---|
Lowest | Highest | ||
Value | Obs | Value | Obs |
4.0 | 23 | 4.8 | 27 |
4.3 | 30 | 5.1 | 22 |
4.3 | 21 | 5.2 | 29 |
4.4 | 25 | 6.0 | 24 |
4.6 | 26 | 6.4 | 28 |
The SAS System |
Results from PROC RSREG |
Moments | |||
---|---|---|---|
N | 10 | Sum Weights | 10 |
Mean | 4.8 | Sum Observations | 48 |
Std Deviation | 1.30384048 | Variance | 1.7 |
Skewness | 1.30609626 | Kurtosis | 2.73318504 |
Uncorrected SS | 245.7 | Corrected SS | 15.3 |
Coeff Variation | 27.1633434 | Std Error Mean | 0.41231056 |
Basic Statistical Measures | |||
---|---|---|---|
Location | Variability | ||
Mean | 4.800000 | Std Deviation | 1.30384 |
Median | 4.450000 | Variance | 1.70000 |
Mode | 4.400000 | Range | 4.80000 |
Interquartile Range | 1.20000 |
Tests for Location: Mu0=0 | ||||
---|---|---|---|---|
Test | Statistic | p Value | ||
Student's t | t | 11.64171 | Pr > |t| | <.0001 |
Sign | M | 5 | Pr >= |M| | 0.0020 |
Signed Rank | S | 27.5 | Pr >= |S| | 0.0020 |
Tests for Normality | ||||
---|---|---|---|---|
Test | Statistic | p Value | ||
Shapiro-Wilk | W | 0.901446 | Pr < W | 0.2272 |
Kolmogorov-Smirnov | D | 0.190989 | Pr > D | >0.1500 |
Cramer-von Mises | W-Sq | 0.075969 | Pr > W-Sq | 0.2161 |
Anderson-Darling | A-Sq | 0.473071 | Pr > A-Sq | 0.1959 |
Quantiles (Definition 5) | |
---|---|
Quantile | Estimate |
100% Max | 7.80 |
99% | 7.80 |
95% | 7.80 |
90% | 6.80 |
75% Q3 | 5.20 |
50% Median | 4.45 |
25% Q1 | 4.00 |
10% | 3.45 |
5% | 3.00 |
1% | 3.00 |
0% Min | 3.00 |
Extreme Observations | |||
---|---|---|---|
Lowest | Highest | ||
Value | Obs | Value | Obs |
3.0 | 33 | 4.5 | 37 |
3.9 | 40 | 5.0 | 34 |
4.0 | 36 | 5.2 | 31 |
4.4 | 39 | 5.8 | 35 |
4.4 | 38 | 7.8 | 32 |
The SAS System |
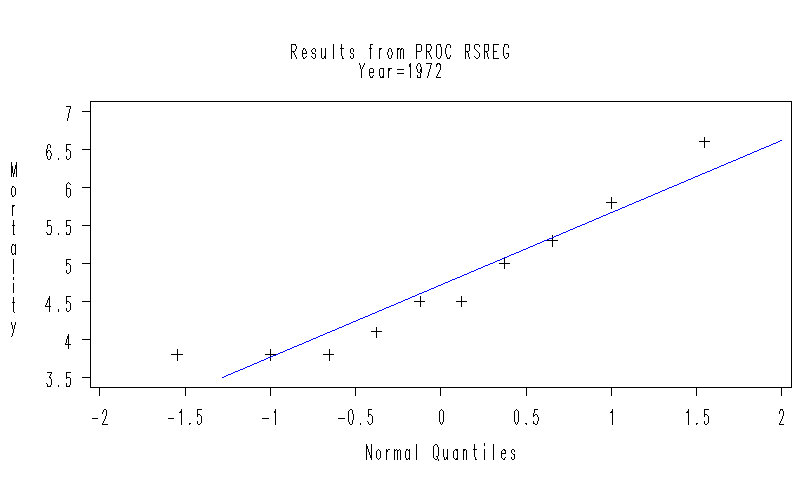
Results from PROC RSREG |
Moments | |||
---|---|---|---|
N | 10 | Sum Weights | 10 |
Mean | 4.72 | Sum Observations | 47.2 |
Std Deviation | 0.95078915 | Variance | 0.904 |
Skewness | 0.89290833 | Kurtosis | 0.00685603 |
Uncorrected SS | 230.92 | Corrected SS | 8.136 |
Coeff Variation | 20.1438378 | Std Error Mean | 0.30066593 |
Basic Statistical Measures | |||
---|---|---|---|
Location | Variability | ||
Mean | 4.720000 | Std Deviation | 0.95079 |
Median | 4.500000 | Variance | 0.90400 |
Mode | 3.800000 | Range | 2.80000 |
Interquartile Range | 1.50000 |
Tests for Location: Mu0=0 | ||||
---|---|---|---|---|
Test | Statistic | p Value | ||
Student's t | t | 15.69849 | Pr > |t| | <.0001 |
Sign | M | 5 | Pr >= |M| | 0.0020 |
Signed Rank | S | 27.5 | Pr >= |S| | 0.0020 |
Tests for Normality | ||||
---|---|---|---|---|
Test | Statistic | p Value | ||
Shapiro-Wilk | W | 0.893614 | Pr < W | 0.1862 |
Kolmogorov-Smirnov | D | 0.191493 | Pr > D | >0.1500 |
Cramer-von Mises | W-Sq | 0.062287 | Pr > W-Sq | >0.2500 |
Anderson-Darling | A-Sq | 0.415674 | Pr > A-Sq | >0.2500 |
Quantiles (Definition 5) | |
---|---|
Quantile | Estimate |
100% Max | 6.6 |
99% | 6.6 |
95% | 6.6 |
90% | 6.2 |
75% Q3 | 5.3 |
50% Median | 4.5 |
25% Q1 | 3.8 |
10% | 3.8 |
5% | 3.8 |
1% | 3.8 |
0% Min | 3.8 |
Extreme Observations | |||
---|---|---|---|
Lowest | Highest | ||
Value | Obs | Value | Obs |
3.8 | 50 | 4.5 | 48 |
3.8 | 47 | 5.0 | 41 |
3.8 | 45 | 5.3 | 49 |
4.1 | 44 | 5.8 | 42 |
4.5 | 48 | 6.6 | 43 |