A custom sinc GUI
Some considerations
- When using the sinc series on a finite interval, the
collocation points "bunch up" near the ends:
Unfortunately, the endpoints are also of most interest, so a selection feature is needed. (A zoom feature won't work when moving slices.) Picking and choosing from logarithmically spaced sinc points is not possible, so just use an array subrange selector for each slice:
- Viewing a 1D-slice (of a 2D region) is nice, but it's even
better when the location of that slice is known:
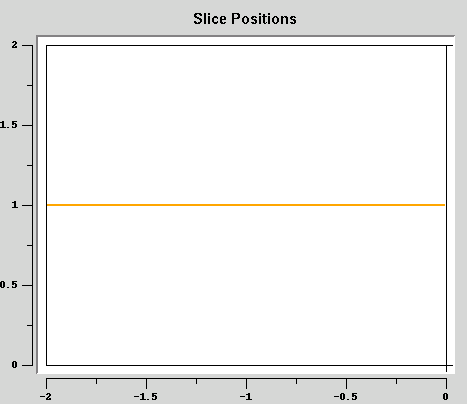
- Of course, there must be a way of choosing a slice to view,
and moving such a selection interactively to observe the
behavior. Picking and moving logarithmically spaced sinc
points is not possible, so just use an array index selector
for each slice:

- Viewing results across multiple rectangles requires
synchronization between the data, to avoid this situation:
- To see convergence (or lack thereof), multiple results need to be viewed simultaneously, and these views should be synchronized also.
- With all the available data, a simple chooser is needed:
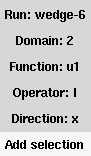
This approach is useful when only one choice (e.g., the Run:) is changed frequently. - It's always nice to know what one is currently looking at,
so here is a legend:

Using the resulting GUI
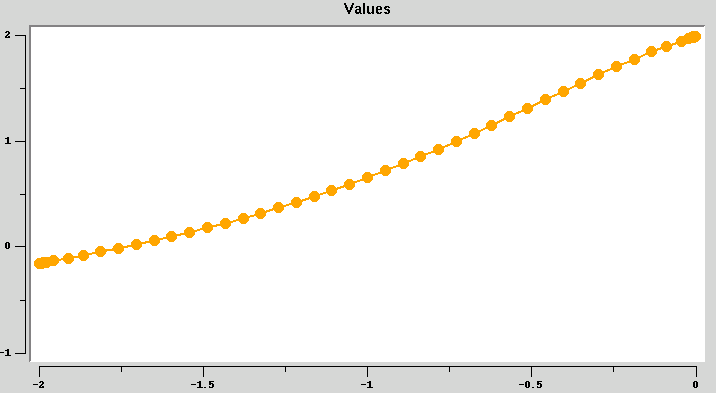
These above elements are combined, along with some other selection mechanisms, to enable some close-up viewing of singular functions. For example, the following shows the computed (N=18) solution along a horizontal slice near y=0.2: 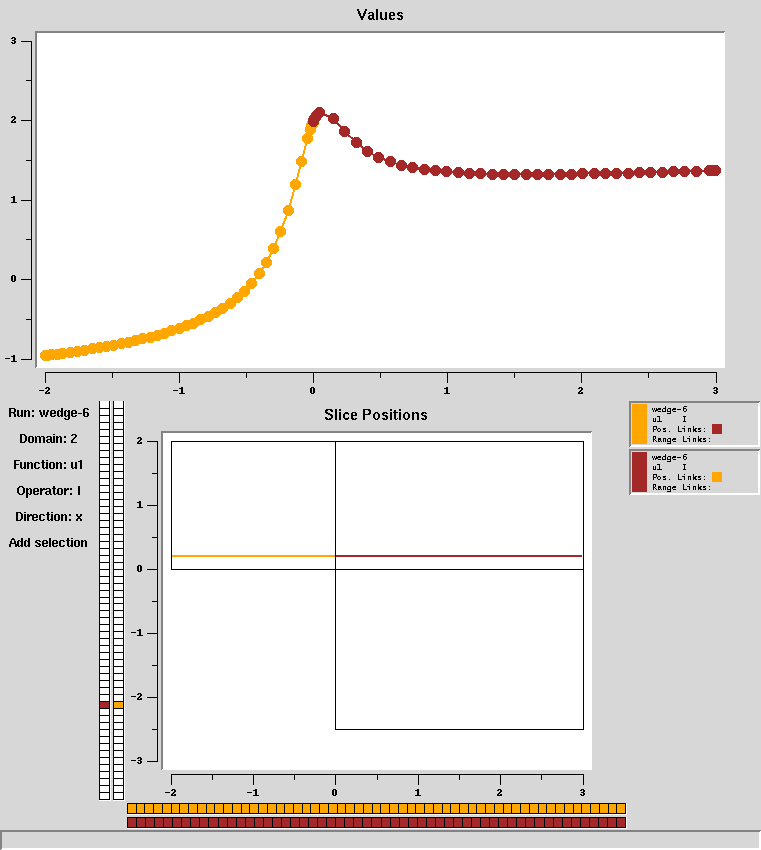 This could (possibly) be done with other methods; but the
interesting part is closer to the singularity at (0,0):
This could (possibly) be done with other methods; but the
interesting part is closer to the singularity at (0,0):
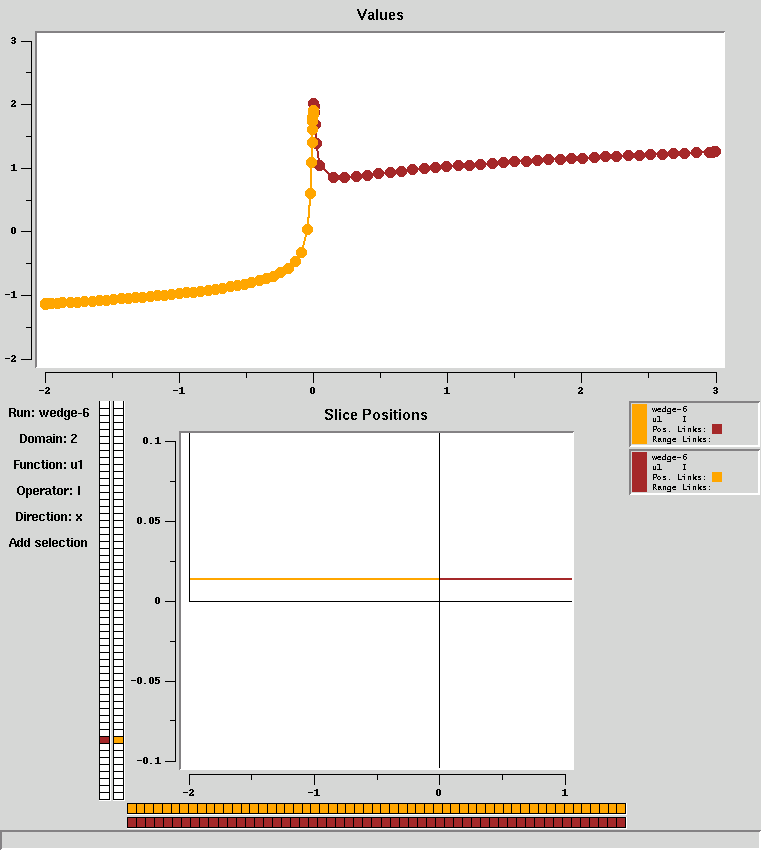 Now, it's not clear what the behavior is near the interesting
region. But this is no problem; just use the array range sliders,
and zoom in on the location graph:
Now, it's not clear what the behavior is near the interesting
region. But this is no problem; just use the array range sliders,
and zoom in on the location graph:
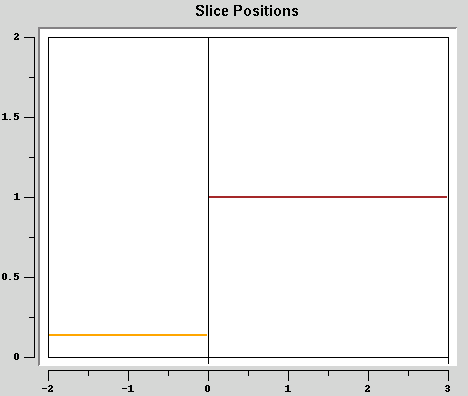
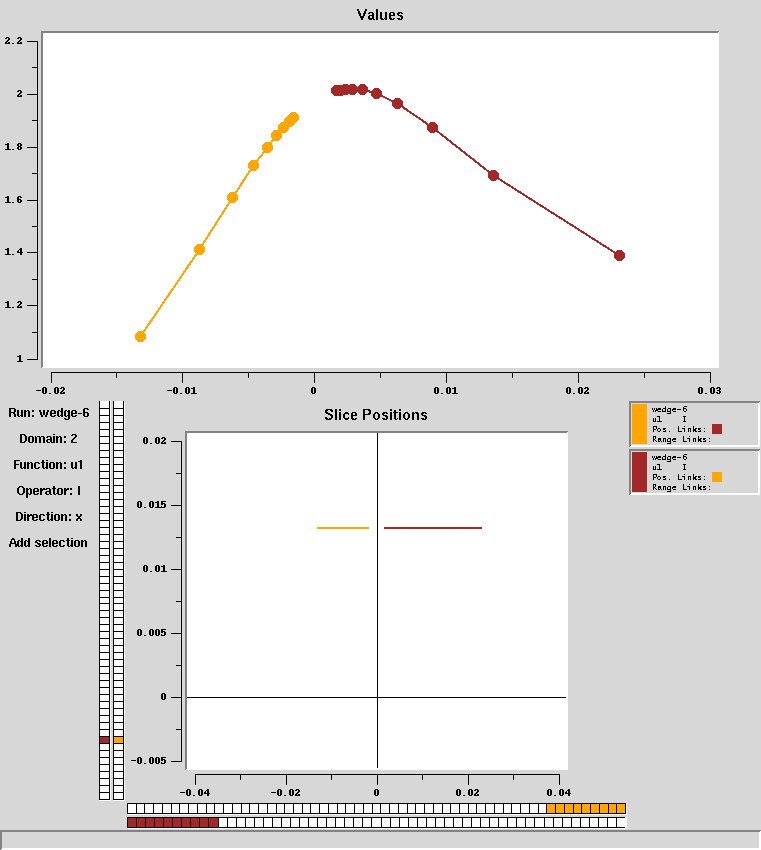 Now the behavior near x=0 is clear. The gap between the left and
right domain (orange and brown lines) is needed when approximating
derivatives near singularities.
Now the behavior near x=0 is clear. The gap between the left and
right domain (orange and brown lines) is needed when approximating
derivatives near singularities.